
《SLEEP中文版》第6卷第1期
青少年对睡眠限制的稳态反应
Homeostatic Response To Sleep Restriction In Adolescents
原文作者
Jelena Skorucak, Nathan Weber, Mary A. Carskadon, Chelsea Reynolds, Scott Coussens, Peter Achermann, and Michelle A. Short
翻译专家
程金湘
审校专家
师 乐
摘要
青少年中慢性睡眠限制的高患病率强调了了解青少年在这些条件下如何调节睡眠的重要性。睡眠调节的一个组成部分是一个稳态过程:如果睡眠受限,那么睡眠强度就会增加。我们对这一过程的了解主要是基于完全睡眠剥夺的研究,并已被纳入人类睡眠调节的数学模型中。然而,一些动物实验表明,适应发生在慢性睡眠限制的条件下,表现出体内稳态反应衰减或者下降。本研究调查在不同的睡眠机会中青少年的体内稳态反应。34名参与者被分为3组,每组每晚分别有5、7.5 或10小时的睡眠机会。每组都接受了9个晚上的方案,以模拟两个周末之间的学校周:2个基线夜(10小时睡眠机会)、5个条件夜(5、7.5或10小时)和2个恢复夜(10小时)。通过额叶和中央区脑电图推导计算了睡眠稳态(慢波活动和慢波能量)的测量值,并与睡眠调节双过程模型的内稳态过程模拟得出的预测结果进行比较。在经验数据和模型预测之间只发现了微小的差异,这表明青少年在慢性睡眠受限中睡眠稳态保持不变。这些发现提高了我们对青少年重复短睡眠影响的理解。
关键词:青少年;睡眠受限;睡眠稳态;慢波活动
图表
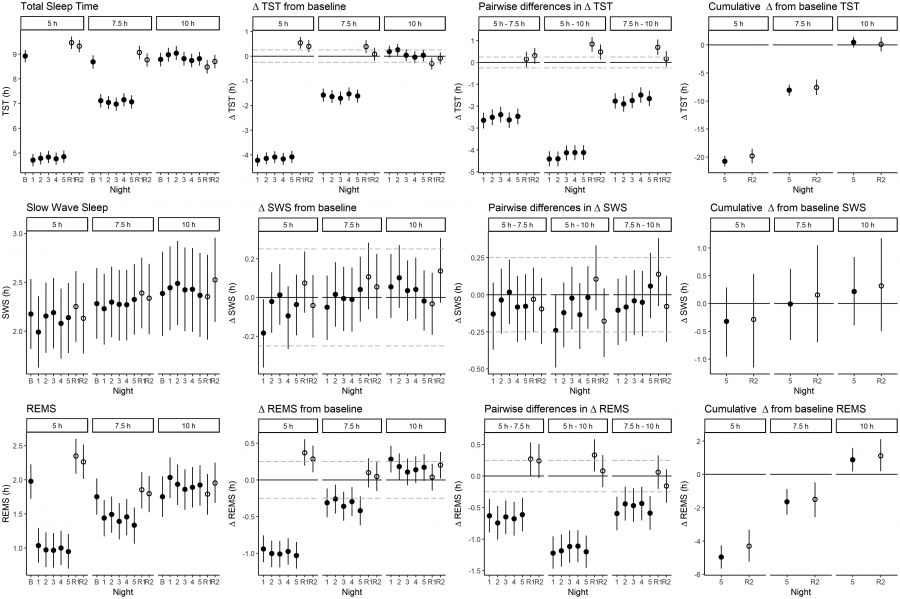
Figure 1.The median of the posterior distribution and the 95% highest density interval (HDI; vertical lines) of total sleep time (TST), time in slow-wave sleep (SWS) and time in REM sleep (REMS) for 5 h, 7.5 h and 10 h time in bed (frst column); difference from baseline (second column); difference between groups (third column) and cumulative difference from baseline (fourth column) are illustrated. n = 12 (5 h, 10 h); n = 10 (7.5 h). B: Average of frst and second baseline night, 1–5: experimental nights, R1, R2: frst and second recovery night. If the 95% HDI does not include 0, this indicates statistical signifcance. If the 95 % HDI does not include the region of practical equivalence (ROPE; dashed lines), this indicates practical signifcance.
Table 1:Sleep variables derived from visual scoring (mean ± SEM).Total sleep time (TST), sleep latency (frst occurrence of stage 2), wake after sleep onset (WASO), sleep effciency, percentage of time spent in sleep stages 1 and 2, slow-wave sleep (SWS; stages 3 and 4), and REM sleep (REMS) for the 5 h, 7.5 h and 10 h time in bed conditions. Cond: condition; B1, B2: frst and second baseline; 1–5: experimental nights; R1, R2: frst and second recovery night. Signifcant differences to the baseline are marked with asterisks (linear mixed model, post-hoc comparison to the average baseline with Sidak correction for multiple comparisons) or hashes (least signifcant difference, LSD).
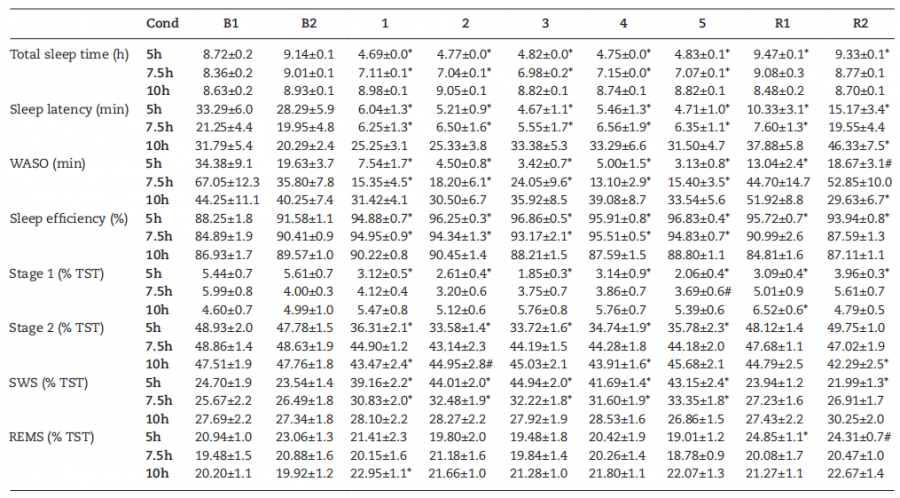
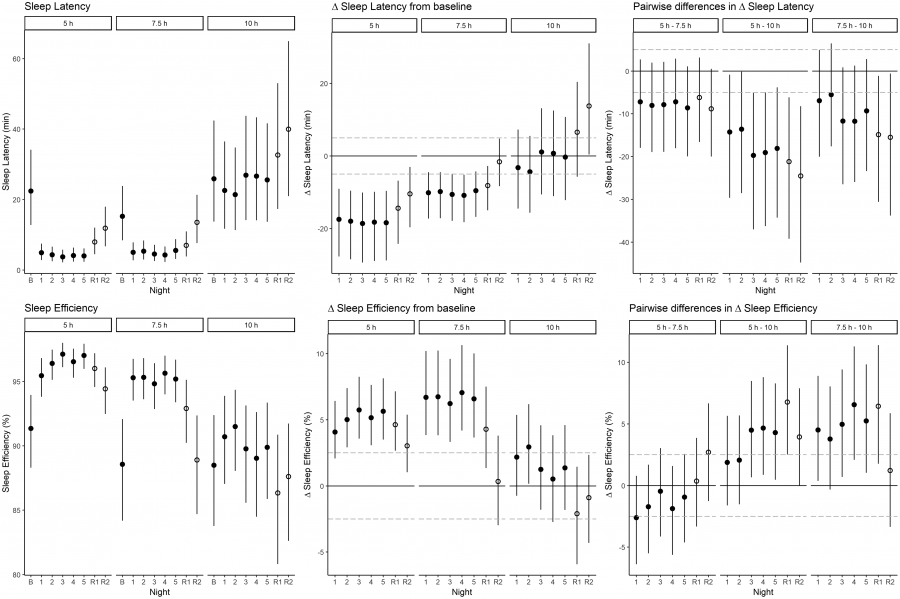
Figure 2.Sleep latency and sleep effciency for 5 h, 7.5 h and 10 h time in bed.The median of the posterior distribution and the 95% highest density interval (HDI; ver- tical lines) are illustrated; n = 12 (5 h, 10 h); n = 10 (7.5 h). B: average of frst and second baseline night, 1–5: experimental nights, R1, R2: frst and second recovery night. If the 95% HDI does not include 0, this indicates statistical signifcance. If the 95 % HDI does not include the region of practical equivalence (ROPE; dashed lines), this indicates practical signifcance.
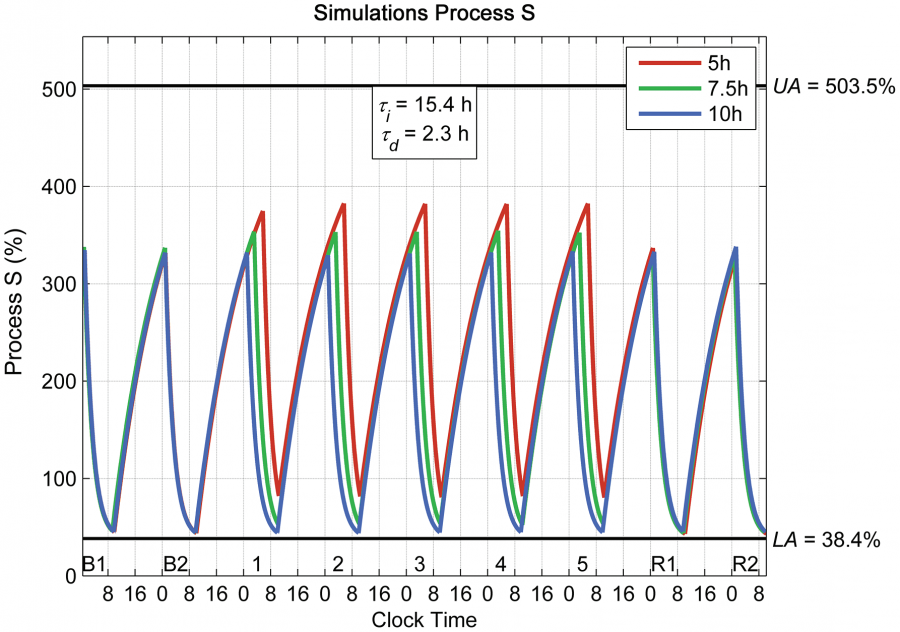
Figure 3.Simulation of the homeostatic Process S for two baseline nights (B1,B2), fve experimental nights (1–5) and two recovery nights (R1, R2) for 5 h (red),7.5 h (green), and 10 h (blue) time in bed. Parameters of the simulation: time constant of increase Ʈi = 15.4 h, time constant of decrease Ʈd = 2.3 h, upper asymptote UA = 503.5 %, and lower asymptote LA = 38.4 % Simulations were performed with the average timing and duration of sleep, (i.e. average time point of falling asleep and average total sleep time). Process S is scaled as in Jenniet al.
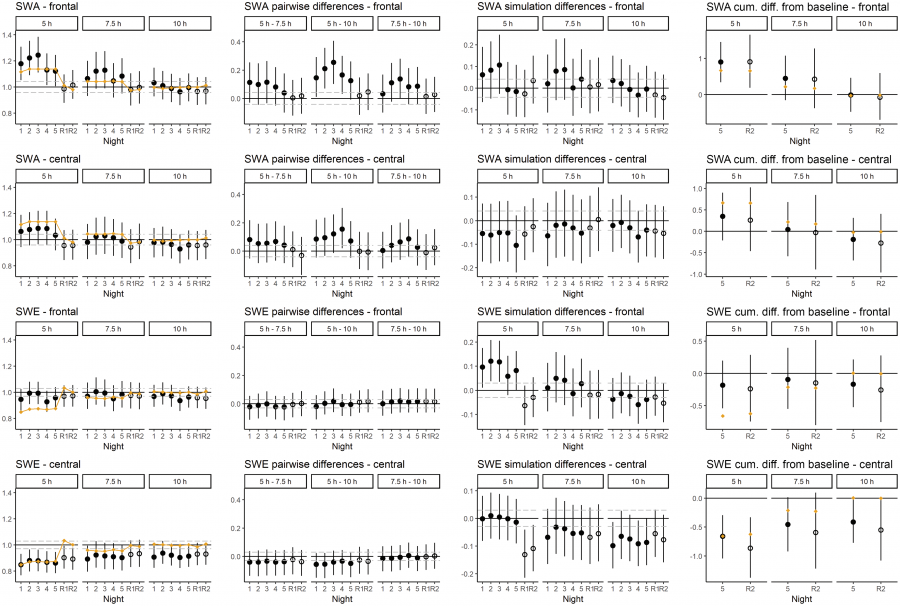
Figure 4. Slow-wave activity (SWA; 0.75–4.5 Hz) and slow-wave energy (SWE; cumulative SWA across entire night) calculated from simulations (orange), as well as from the empirical data (frontal and central derivations). The median of the posterior distribution and the 95% highest density interval (HDI) are depicted. Empirical data are the average between left and right hemispheres. All values are presented relative to the average baseline (represented as 1). Simulations of Process S were based on the average sleep timing derived from the data. SWA was calculated from the simulations as mean of Process S over the frst 354 30-s epochs, and SWE as integral of Process S from sleep onset until sleep end The cumulative difference from baseline was calculated across experimental days and is presented for the last ex-perimental night (N5) and for the second recovery night (R2). n = 12 (5 h, 10 h); n = 10 (7.5 h). If the 95% HDI does not include 0, this indicates statistical signifcance. If the 95 % HDI does not include the region of practical equivalence (ROPE; dashed lines), this indicates practical signifcance. 1–5: experimental nights, R1, R2: frst and second recovery night.
来源:SLEEP中文版第6卷第1期摘要2
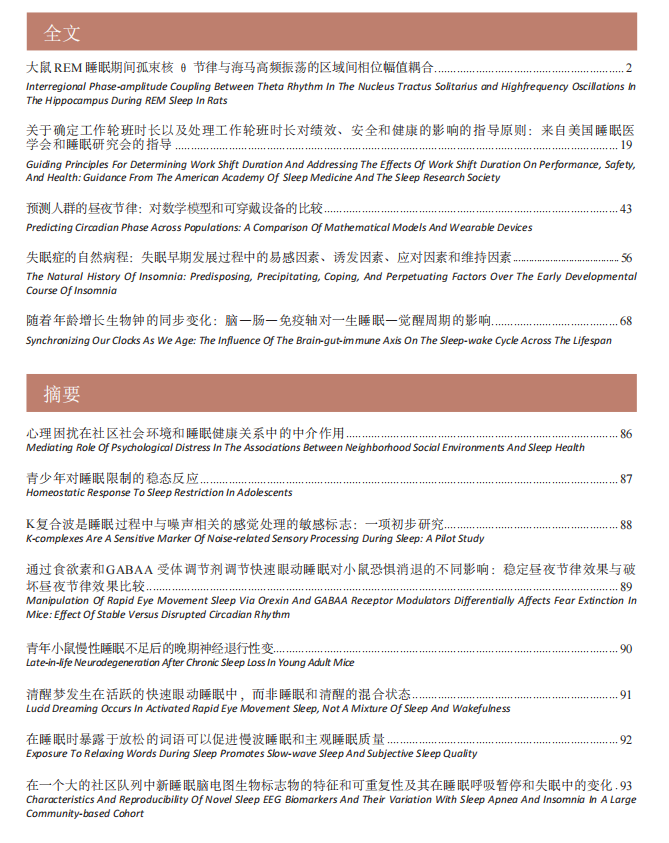
本期目录
《SLEEP中文版》编委会云集国内睡眠领域众多优秀专家、学者。各位编委以极高的热情和严谨的专业精神投入到论文的翻译审校中,经过数月辛勤筹备与精心打磨,《SLEEP中文版》第七期电子版将陆续发布!
编委名单
杂志简介
SLEEP 杂志创刊于 1978 年,是美国睡眠研究学会的官方期刊,由牛津大学出版社出版,在国际睡眠研究领域期刊中排名第一,五年学术影响因子高达 6.0分,是一本高质量、高水平的睡眠医学专业杂志。
《SLEEP中文版》计划全年出版两期,遴选并翻译原刊精华内容,旨在面向临床、面向基层、面向大众,为读者提供第一手的资料,加速新技术、新方法、新理念的普及,并促进中国学者在高水平杂志发表研究成果,为中国睡眠医学事业的发展再添动力。中文版编委会由主编、执行主编、副主编、编委及学术秘书构成,共计96人。
原标题:【第7期 摘要】K复合波是睡眠过程中与噪声相关的感觉处理的敏感标志:一项初步研究
本文来源:SLEEP前沿(ID:gh_b460d40d8213),转载引用请注明原出处